Two years ago, I was counting active nests of Rooks in the flat agricultural landscape north of Belgrade, Serbia. We drove for about 290 km through the 400 square kilometres expanse of Pancevacki Rit and found 8 breeding colonies with 252 occupied nests, or a density of 1.6 nests per 1 km2. Without an exception, rookeries were within suburbs, villages or large farms (in such cases – next to buildings), away from the riverine forests bordering the area, tree lines or smaller groves in the open.
The smallest rookery in Pancevacki Rit had a mere 4 nests, the largest 102 – on average, 31.5 nests per colony. 25 nests (9.9%) were in four rookeries with 9 or fewer nests, 125 (49.6%) were in three colonies with 34 to 55 nests, and the rest (40.4%) were in the largest rookery.
In the northern Backa region of Serbia, in the mid-1970s there were more than 37,000 active nests of Rooks, while in 2009 there were less than 8500, indicating a loss of more than 76% over a time span of 35 years (source).
 As I said, Rooks breed within villages, towns and cities, such as Belgrade with about 2 mil people, where street tree lines, especially of London Planes, become the favourite breeding spots. And what is the trend of those Belgrade rookeries? We do not know.
There are some student papers that I still have to lay my fingers on, but we do not have a broad base-line study of number and position of colonies or the number of nests within them. Nor the funds to hire the researchers.
And that is where I started to experiment with the eBird. Some local birders do readily share observations and I hope that some more will join to count at least rookeries. I opened a new eBird account Corvus frugilegus Census (a bit awkward, but I was looking for a name that sounds more or less the same in both English and Serbian) inviting them to count and report rookeries at eBird, and to share those reports with the Corvus frugilegus Census. What do I hope to achieve?
I hope that we can cover most of the city (but will also accept reports from other regions), locate and count rookeries (and possibly continue to do so in the years to come). The best counting season is April, but I will accept late March and early May reports, too (actually, I already have a few early reports – the birds have occupied the nests by now). In the analyses, I will use the highest recorded number for each colony, and I hope that eBird can produce a map of those rookeries (Belgrade reports from mid-March – mid-May that have the word “rookery” in the location name and not just all reports for that region and period), of which I am not yet sure.
I expect to achieve less than I hope for (I am worried about the size of the city and number of scattered small colonies in relation to a small number of eBirders), but it should turn out to be a valuable exercise in finding how suitable eBird is for such counts (eg. since there is no option to count the nests, those numbers will be entered as Details). The spring is coming and we shall see.
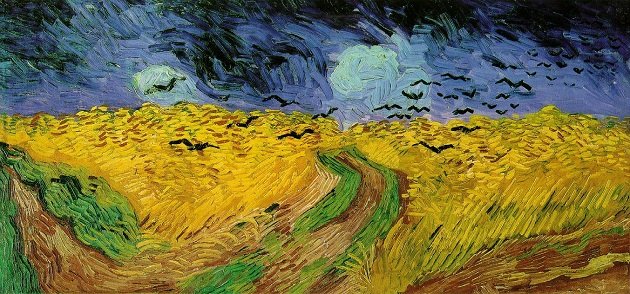
Illustration: Wheat Field With Crows by Vincent van Gogh




Good luck. It will be interesting to hear about the results.
As long as it doesn’t turn out to be boring (too few responses), I’d be happy with the outcome. The more, the merrier.
Thanks for sharing your project. I hope you will post your results. I am interested in making map of seabird rookeries here in Southern Alaska with citizen science observations using eBird. But there are some problems with mapping precise locations and stating that this is a nest, not just birds, in the eBird platform.
Yes, I do not know what else to do but to transfer the data to Google Earth, one location at the time (a bit annoying). eBird map would not show only breeding sites of the species, but all observations, and this is the study of a rather widespread and easily noticed corvid, recorded virtually everywhere in the lowland towns and agricultural areas.
I will write about that this fall.