In November of 2015, I saw a Northern Mockingbird 20 out of the 30 days. A Brown-headed Nuthatch? 3 of the 30 days. European Starling? 8 days.
If you’re a rational person, you’re asking yourself two questions:
- How does she know that?
- Why does she care?
Because I like symmetry, I’ll give you two answers:
- I’m a little bit crazy.
- I really, really like data.
On May 22, 2015, I embarked on a 365 day-long project. For the duration of a year, I was going to record every species I saw every single day. Yep, that’s right. I was going to list every day for an entire year.
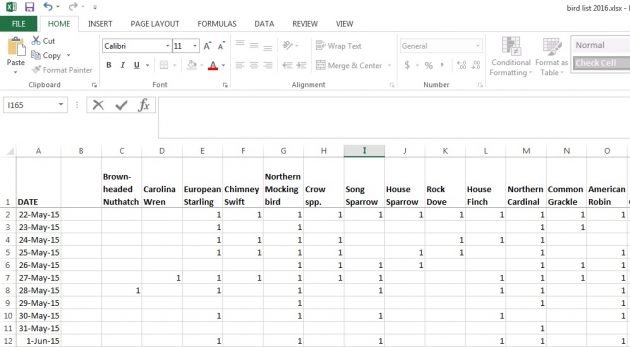
I started out using little paper notebooks, keeping them in my pocket, backpack, or purse and jotting down the species when I saw them. When a raptor crossed my view but I couldn’t quite identify it, I simply wrote, “Raptor species,” recording as much as I did know. Eventually I switched to a note-tracking system on my phone after a near-miss between my notebook and a lake. Periodically, I would upload the list into an Excel file. Slowly, the days ticked by, and my long list accumulated.

Example data sheet.
My friends laughed at me, and I laughed along with them. Why did I care how many times I saw a Northern Mockingbird, American Robin, Brown Pelican, or one of the many hundreds of other species I tallied during the 365 days? Wasn’t I acting a little too Type-A? A little too neurotic?
Ah, but here’s where my love of data comes in. As I write, I am compiling an analyzable data sheet which will tell me exactly how many times I saw every bird on my list for the year. I’ll be able to tell you the average number of species I saw in a day, in a month, in a summer.
The birds I see form an integral part of my environmental landscape. According to Audubon’s modeling, 314 North American bird species will be seriously threatened by climate change by the end of this century. I want to know how many of these species I saw during the past year, how many I see on a regular basis. So often, scientific models and predictions remain intangible to people; using my day-to-day bird experiences, I want to show people that they will lose an element of their lives if these birds disappear forever.
Data analysis often takes a while, but stay tuned for my results. I have to admit, after carefully paying attention for so long, I’m having a hard time stopping myself from continuing to record everything I see!


Erika, I think that’s awesome! I’ve always wanted to do the same thing but I’ve never been dedicated enough! Very cool!
If you’re a little crazy, I must be totally crazy! LOL. I have been keeping daily lists for over ten years now. I’m hoping to be able to track changes in species, or arrival or departure dates, etc. I love the idea of using the data to help people understand on an emotional level what climate change might mean for their familiar birds. Would you be interested in sharing your templates and the analyses you’re doing? It would be fun to compare two data sets – one from the southern U.S. And one from New England.
If you want to keep track of your total day lists and you put your sightings in eBird, a Maryland birder named Mike Ostrowski has created a macro that will summarize them from your downloaded eBird data. It is set in the second tab to run for Maryland, but depending on your operating system you can change it to run for a certain state (by putting in US-VT, BZ-BZ, etc. instead of US-MD) or All if you want it to summarize your life. If that doesn’t work, take your downloaded eBird data and change the location data under state/province for whatever area you want to “US-MD” (making sure to change any preexisting US-MD data to something else first) and it will run that way. You could also trim the downloaded eBird data if you only want it to do a certain date range. The macro is listed as “Day Listing Macro for Maryland eBird data from Mike Ostrowski” at http://www.billhubick.com/documents.php.