The adventure of the second European Breeding Bird Atlas, or EBBA2, was the topic of one of my first posts here at 10,000 Birds: In a warm Catalonian March, Barcelona is filled with sunlight and full of Rose-ringed and Monk Parakeets. Despite all that sun, I have spent days in a darkened Museu Blau on a pan-European bird atlassing workshop hosted by the Catalan Ornithological Institute.
A few years on, the adventure continues: It is a cold night in early March and the young moon is barely visible through the thick branches of the oak forest along our census route. A portable speaker is placed on the top of the car, playing Tawny Owl calls from a smartphone. In a very short time, we get two responses, two birds calling from opposite directions. Although we do enjoy it immensely, we are not doing it for fun, but to gather information on distribution, habitat choice and density of breeding pairs.
And, some time later, during the final stages of the bird-atlassing work, computer models of Serbian ranges for some 150 bird species were produced for the first time ever: Some bias was created because of the large data set from Belgrade and environs where the majority of active eBirders live. The consequences were amusing. E.g., based on so much in-city data, the software recognized towns and villages as the primary habitat for the Great Spotted Woodpecker, supposedly far more common in urban areas than in forests.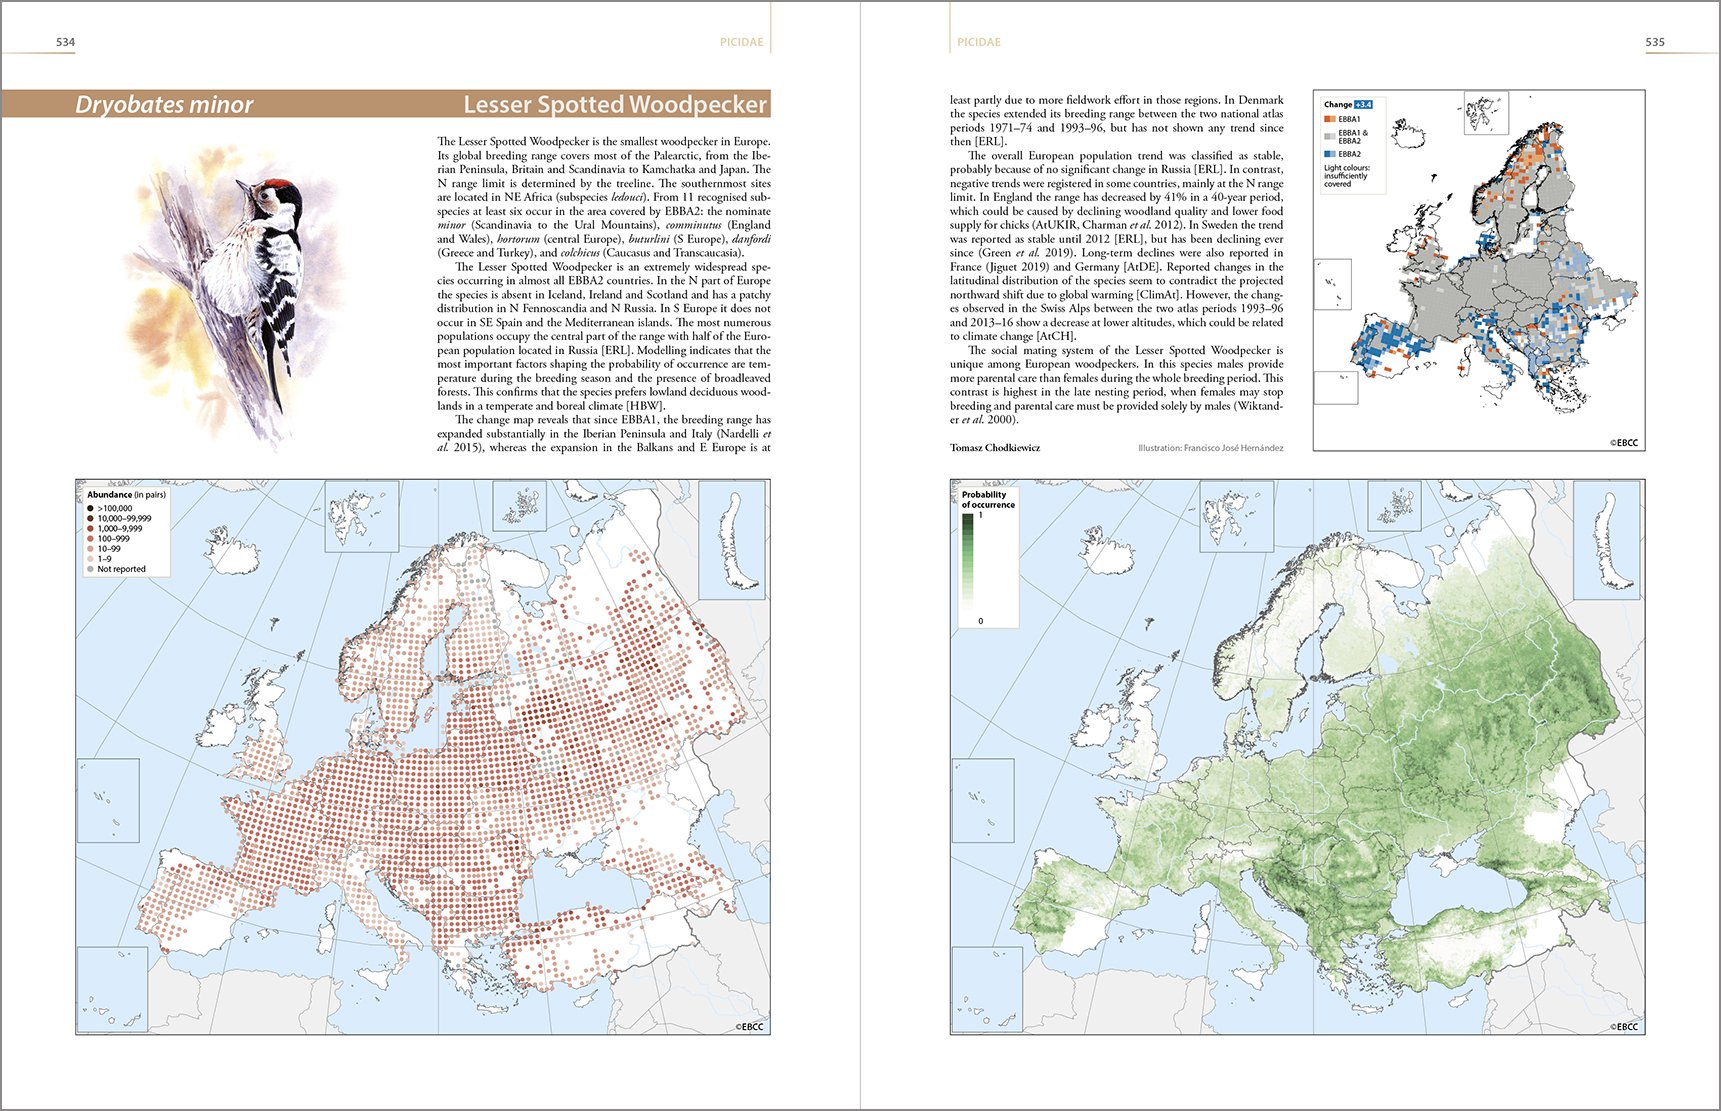
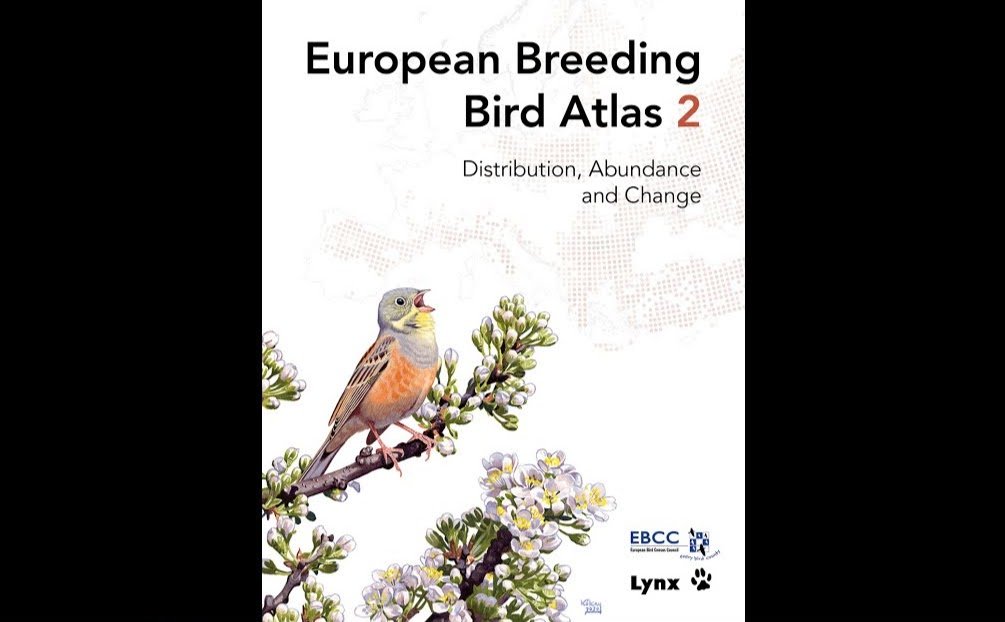
And ten years later, I found my name among the data providers in this magnificent book – possibly the most important ornithological publication in Europe in the 21st century, so far. Still, to be more realistic, there were 120,000 volunteer fieldworkers from all countries in Europe to collect data on 596 breeding bird species from across 48 countries and 11 million square kilometres in a systematic and standardised manner – one of the biggest citizen science projects on biodiversity ever. It seems fitting that I illustrated that first post on Barcelona workshop with bird paintings by my friend Szabolcs Kokay – now his Ortolan Bunting painting is on the front cover of the atlas.
The huge fieldwork effort resulted in unprecedented geographical coverage for a biodiversity atlas in Europe, including all areas up to the Ural Mountains and the Caspian Sea (mostly European Russia) that were not well covered for EBBA1 (1997). European Breeding Bird Atlas 2 presents information on all species reported to breed in the study period (2013 to 2017) and some with more uncertain breeding status. Original artwork illustrates all species with a full account. The text was written by 348 authors, while illustrations were provided by 46 artists.
This book has an imposing presence on every desk: a 24 × 31 cm / 9.4 x 12.2 in hardback with 947 pages weighing 5 kg / 11 lbs is not to be taken lightly. A total of 556 species are treated with a full species account including maps, textual description of environmental factors influencing its distribution and an illustration. Some species are shown in one, but many more in two pages. Species accounts include 50×50 km maps (usually showing abundance data – 689 such maps), modelled distribution maps with a resolution of 10×10 km (showing the modelled probability occurrence for 222 breeding birds) and change maps (comparing current distribution with that obtained 30 years ago, 446 maps). Many species have moved their ranges northward by an average of 28 km / 17.4 mi (ca 1 km per year) in response to the climate changes.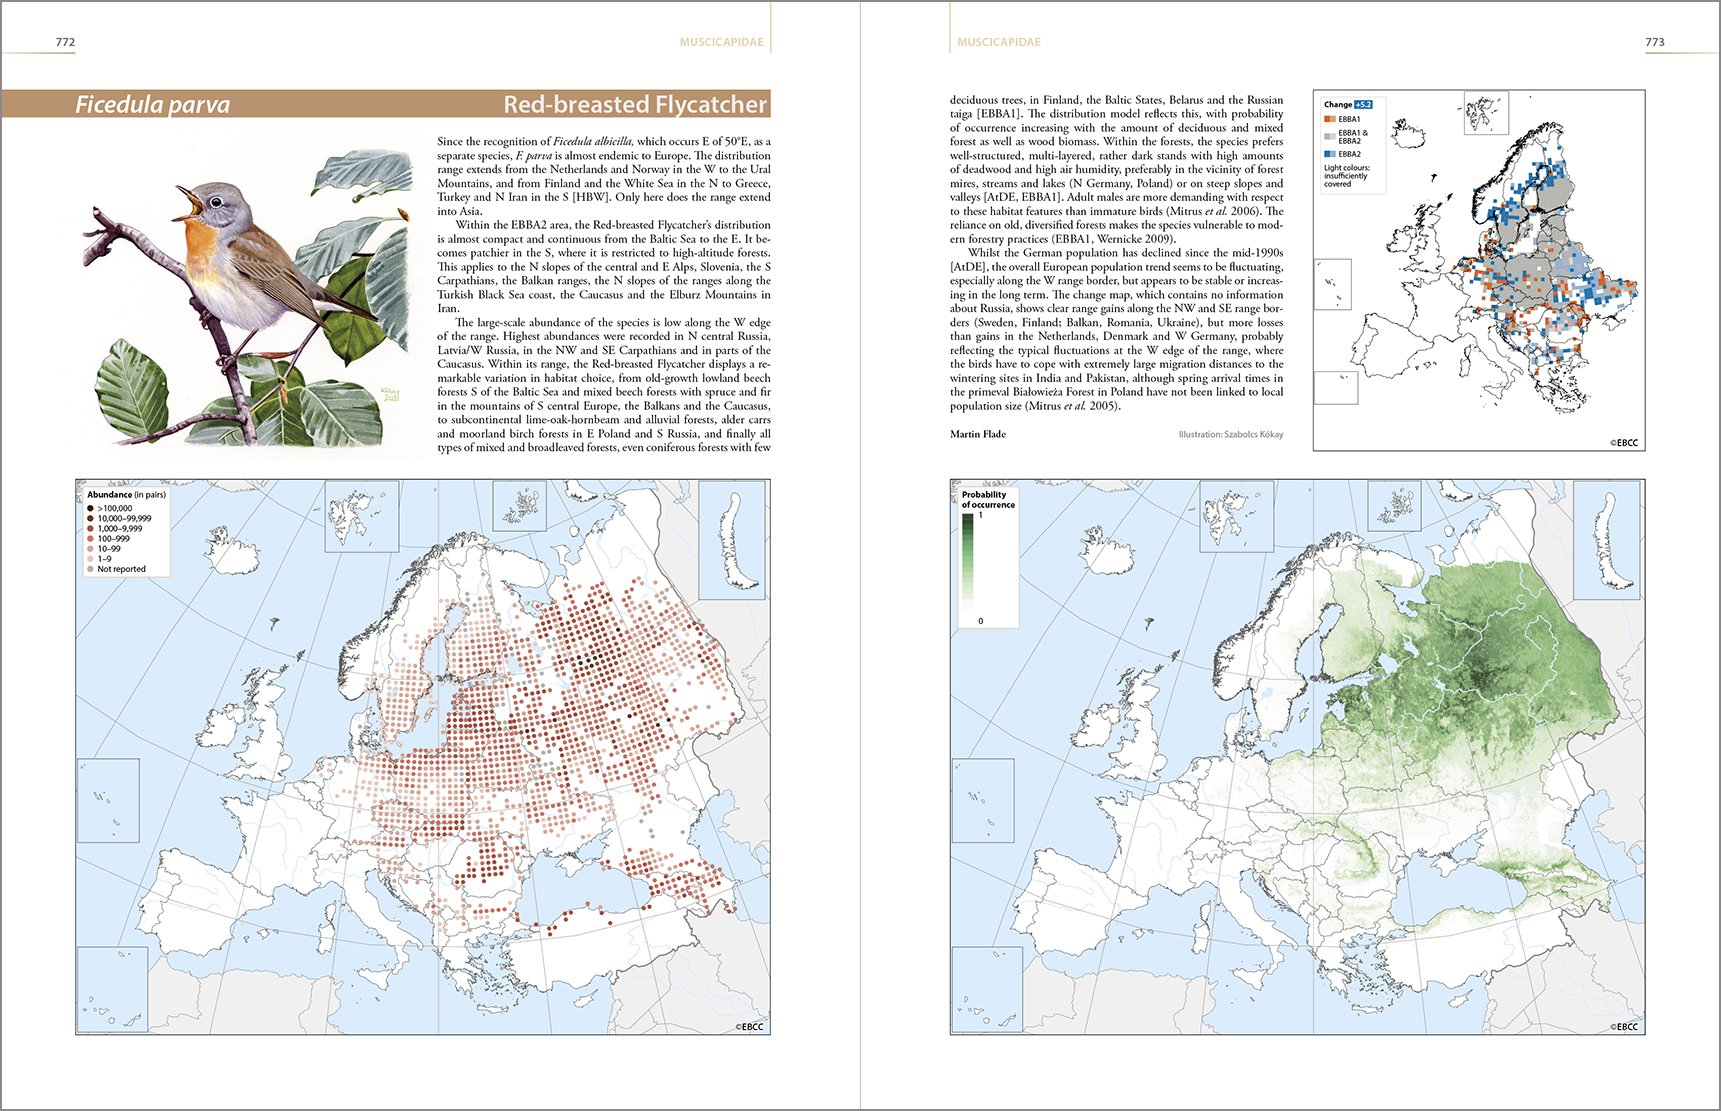
Clearly, European Breeding Bird Atlas 2 is primarily intended for scientists and policy makers to protect and save these species, but how about an ordinary birder? In order to understand bird distributions and why they are where they are, one must study the biomes of Europe, described in Species and habitats chapter of the introduction. Secondly, to better navigate the species accounts, study the Interpreting species accounts at the end of the introductory pages. The hidden treasures are in the main chapter, the Species accounts which tells you which areas to check for this or that more restricted range or localised species. So, ahead of your next vacation, do check the atlas to discover which lifers await you there.
Many national bird atlases should sprout from this one (from Denmark to Serbia, to name but a few), and I cannot wait to see these maps in the next edition of the Collins Bird Guide/Birds of Europe. There is one more way to use this atlas, primarily for tour operators: more than 50% of the species occurred in less than 10% of all surveyed squares. Hence, study the Species and habitats and, combined with Biogeographic patterns in the distribution chapter, construct new bird tours of Europe. Due to its well-developed infrastructure, in some regions it is possible to combine three (Scandinavian, Iberian and Apennine Peninsulas) or even four major biomes (Balkan) and significantly increase the yields of your guests.
European Breeding Bird Atlas 2 – Distribution, Abundance and Change
By: Verena Keller, Sergi Herrando, Petr Vorisek, Marti Rodriguez-Franch, Marina Kipson, Pietro Milanesi, David Marti, Marc Anton, Alena Klvanova, Mikhail V Kalyakin, Hans-Gunther Bauer, Ruud PB Foppen
967 pages, 568 colour illustrations, 1357 colour distribution maps, 11 tables
Publisher: Lynx Edicions









Leave a Comment